

Collecting data for businesses is not a problem today. You may have thousands of contacts in your CRM, hundreds of graphs in Google Analytics, and dozens of reports in your accounting department. But the question remains: how can you extract a clear picture from this mass of information?
- Why did conversion rates fall even though traffic increased?
- Which channels are best for selling products?
- Where exactly are you losing customers — at the checkout stage or after consultation?
And you can get clear answers. For example, if an advertising campaign has a lot of clicks but zero sales, it is a sign that the target audience is not set correctly. If conversions increase on certain days or at certain times, it is advisable to change the display schedule. Expensive goods may sell worse through some channels and better through others.
Power BI experts can build a clear picture for your business. They not only process data, but also visualize it. As a result, you will clearly understand how sales will change if you change the price, supplier, or sales channel. Or whether a new offer will be in demand.
Find out when it's critical to bring in Power BI developers and get a checklist to help you prepare for collaboration as effectively as possible.
What Can A Business Gain From Working With A Power Bi Developer?
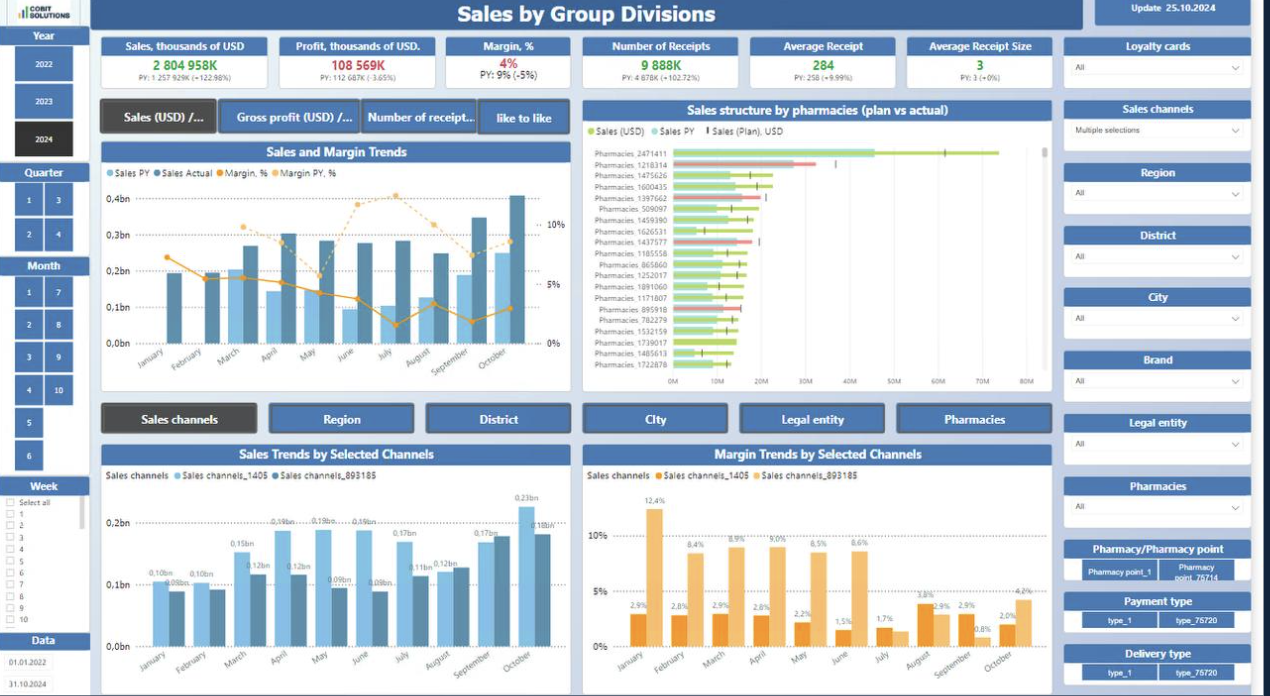
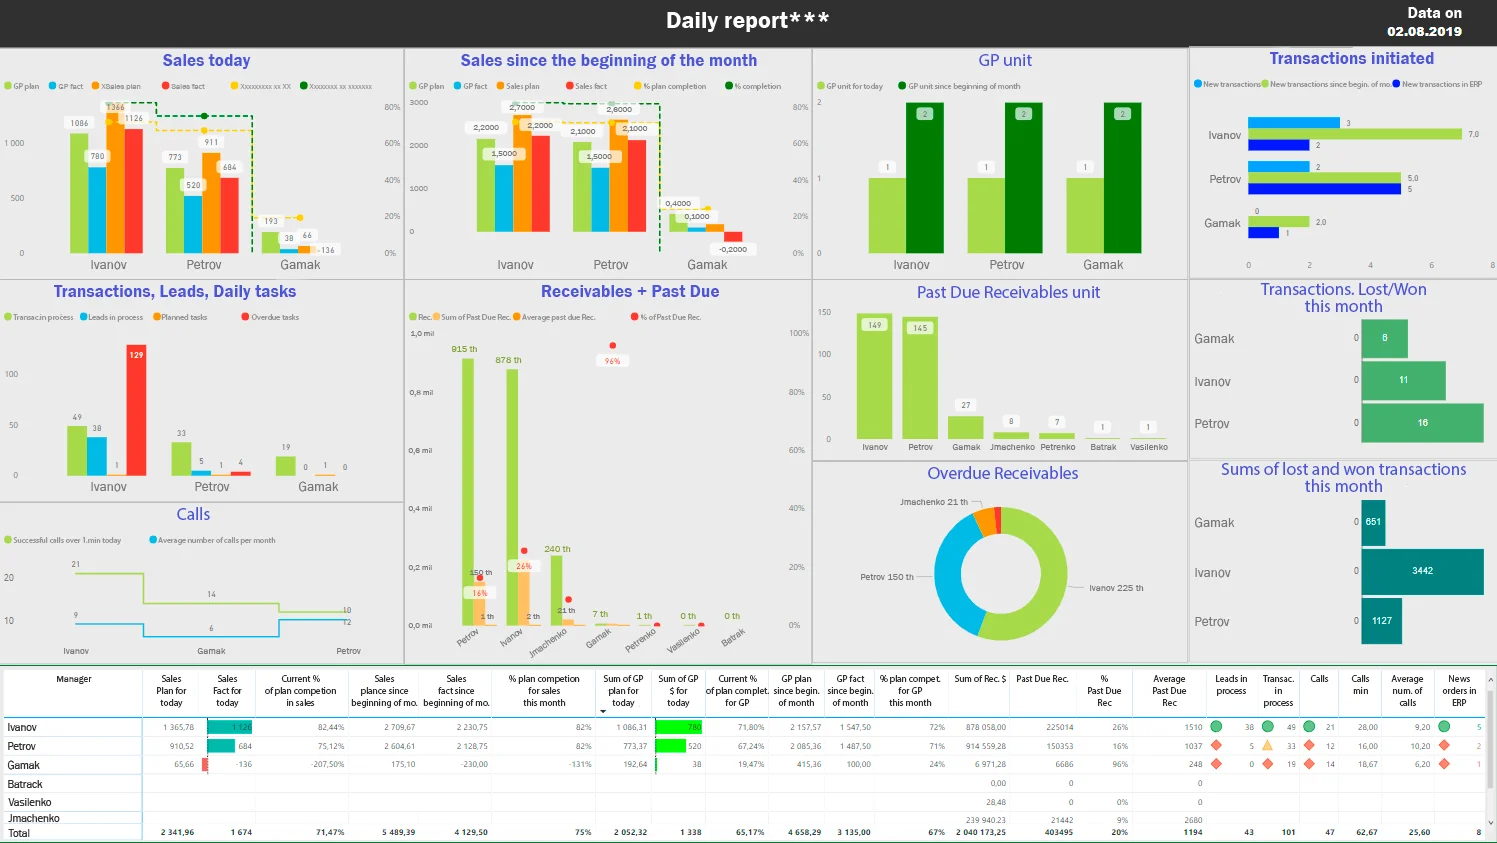
- One interactive dashboard instead of dozens of scattered reports. Managers can see key indicators in one place — no Excel, no manual compilation.
- A clear understanding of what works and what doesn't. For example, which advertising campaigns are profitable and which are simply wasting the budget.
- Operational control over the business. Data is updated automatically — no need to wait for a weekly report from an analyst.
- Identification of hidden patterns. For example, customers from a certain region buy more, but also return goods three times more often.
- Forecasting based on real data. The business can see how revenue will change if costs are reduced or prices are lowered or raised.
- Reduction of errors and duplication. Data from different systems is synchronized — there is no confusion between versions.
- Transparency for investors and partners. You can show real figures, trends, and performance.
10 Signs That It's Time To Hire Power Bi Developers
- There Is Data, But No Answers
If data is not linked and entered manually, the business will receive conflicting reports. How does this look in practice? A pharmacy chain collects data on sales, stock levels, promotions, and seasonal fluctuations in demand on a daily basis. The CRM stores purchase history, the financial system stores purchasing costs, and the marketing system stores campaign results. But when management asks analysts, “Why did sales in the central region drop in October? Should we continue the vitamin promotion?”, there are no answers.
If they had a dashboard set up, analysts would see that the supplier or logistics company changed at that time. So, the quality of goods declined, or there were delays in delivery. And until quality or supply is restored, spending money on marketing campaigns is not advisable.
- Reports Take Too Much Time And Are Still Inaccurate
When a business relies on manual report preparation, management decisions are always delayed. For example, a retail chain generates a weekly sales report: managers from different branches collect data, check it in Excel, and send it to management at the end of the week. While analysts are checking the numbers, the company continues to purchase goods for which demand is already falling and misses the opportunity to change its product range.
If the report were automatically updated in Power BI, managers would see the dynamics on a daily basis. They would be able to reduce orders for unpopular items and redirect the budget to growing categories. Instead of reacting after the fact, the business would be proactive.
- Each Department Has Its Own Version Of The Truth
If data is stored separately in each department, the company loses its “common reference point.” Imagine this situation: the finance department calculates profit using a standard method, the marketing department uses its own indicators, and management receives conflicting figures. It turns out that the sales report shows a profit of $2.5 million, while the financial report shows only $1.9 million because some departments included bonuses and others did not.
In such a situation, meetings turn into arguments about “whose truth is more correct” rather than a search for solutions. A single data model in Power BI allows you to reconcile metrics across all departments: everyone sees the same numbers, but with different levels of detail. This shifts the focus from data verification to analysis and business development.
- No Single Dashboard For Management
Managers often receive separate reports on sales, expenses, inventory, and customers. Each report is in its own format, covering different periods, without agreed-upon indicators. To understand how profitability has changed, you need to manually compile data from several sources.
This was the case at a distribution company working with FMCG. Sales were growing, but profits were falling. Management couldn't understand why. The finance department sends a report on delivery costs, logistics — on routes and delays, warehouse — on stock balances, sales — on orders, and marketing — on campaign results. But it was difficult to tie this all together into a single picture.
When the dashboard appeared, the manager saw that delivery costs had increased precisely for goods that were hardly selling, and that promotions were promoting items with minimal margins. At the same time, inventory was piling up in the warehouse because logistics did not take into account actual demand in different regions.
- You Don't See Trends — Only Facts
Every company receives daily reports in the format of how much and what was sold, what was the profit. But these data are like “still frames”: they show what happened, but do not explain how the situation changes over time. When a manager sees that revenue has fallen, he does not know whether this is a one-time failure or the beginning of a systemic decline.
This was the case with a pharmaceutical distributor. Sales fluctuated by region, but without comparisons by month, segment, and channel, no one could say where the decline began and why. The reports showed only actual figures — without dynamics or context.
When the dashboard appeared, analysts saw that the decline had begun two months earlier — right after the delivery terms changed. In one region, the number of returns increased, while in another, conversion rates fell after a promotion. This allowed them not only to “see the fact,” but also to understand the trend and the cause, so they could finally intervene.
- There Is No Model That Shows The Break-Even Point Or Roi
When an enterprise launches a new product on the market, it does not always understand how much it needs to sell to break even. Or what price ensures profit, and which channel provides real returns. If there is no model that links costs, volumes, prices, and conversion, decisions are made “by eye.”
In such a situation, the business either overestimates its potential or is too cautious — and misses opportunities. The product may be sold below the break-even point, and the marketing budget may be spent on channels that do not provide a return. The team sees the result after the fact, when time and resources have already been lost.
If a startup turns to external analysts or financial advisors in time, the situation can be changed. The internal team receives a model that shows the break-even point, critical price, minimum sales volume, and expected ROI by channel. This allows you to weed out unprofitable scenarios before launch and lay out a budget model that can withstand scaling.
For example, a startup plans to launch a new subscription service. Without a model, it is unclear whether advertising will pay off, how many customers are needed to break even, and what price will not deter demand. It tests several options and spends its budget without understanding what works. With analytics, it immediately sees that at a price of $12 and a conversion rate of 3%, the ROI is negative, while at $9 and a conversion rate of 5%, the business breaks even. This allows you to launch not just an “interesting idea,” but an economically sound proposition.
- Excel And Human Resources Are Feeling The Strain
When businesses rely on manual work in Excel, employees spend a significant amount of time compiling, checking, and recalculating data instead of analyzing it. For example, at a distribution company, many analysts spend 5–6 hours each week compiling reports on inventory and sales from various branches. This delays management decisions and causes employees to burn out and make more mistakes.
Automated dashboards in Power BI reduce the workload: data is collected from all sources and updated automatically. Employees can focus on analysis, identifying causes of change, and strategic proposals instead of spending time manually converting numbers.
- Businesses Are Preparing For Digital Transformation Or Audit
When a company transitions to a new ERP system, prepares for investments, or undergoes an external audit, complete transparency is required: the connection between expenses, profits, processes, and risks. However, if data is stored in Excel, entered manually, and reports are fragmented, even basic questions can be challenging:
— What percentage of expenses does each channel account for?
— Where do delays occur in the supply chain?
— Which products have a stable margin throughout the year?
This was the case at a pharmaceutical holding company that was preparing to transition to SAP. Each department sent in its reports, but it was impossible to reconcile them: different formats, different periods, different indicators. Auditors could not confirm the logic of the calculations, and management could not justify the expenses.
When the dashboard appeared, it became clear:
- which processes are duplicated or ineffective;
- which expenses are not related to profit;
- which channels work consistently, and which generate risks.
This allowed us not only to pass the audit, but also to rebuild the management logic — from manual to systematic.
- Analytics Does Not Scale With The Business
If a company is expanding its geography, adding new channels, and launching new products, then it cannot allow its analytical system to remain at the level of “manual Excel.” In this format, reports take longer to prepare, there are more errors, and responses are provided too late. Management cannot see what exactly is “falling through the cracks” in the system because the analytics cannot keep up with the pace of change.
This was the case with a building materials distributor that opened new warehouses and launched an online channel. Data from new sources came in different formats, integration was manual, and reports were contradictory. When profits began to fall, no one could say what the problem was: whether it was the channel, logistics, or the product range.
When the analytics were rebuilt, an end-to-end model emerged: each channel automatically transmits data, indicators are aggregated by region and product, and the manager can see which warehouses are operating efficiently and which are generating losses. This allowed the company to scale up without losing control.
- Branches Operate In Different Realities
When a company has several regional offices or points of sale, management naturally wants to understand which branches are operating efficiently, which are costly, and which are generating stable profits. However, if each branch conducts its own analytics—with its own metrics, periods, and calculation logic—comparisons become inaccurate and time-consuming.
- In one region, margins are calculated by category, while in another, they are calculated by SKU.
- Some submit weekly reports, while others submit monthly reports.
- Sales formats are mixed: online, offline, distribution — without a single structure.
This was the case at a medical company with a network of laboratories in various regions. Each branch conducted its own analytics: different periods, different report formats, different cost calculation principles. To compare the effectiveness of the locations, analysts manually compiled the data in Excel — this took several days and did not guarantee accuracy:
- The names of services and categories did not match in the reports.
- Some branches calculated expenses at the level of areas, while others calculated them at the level of individual procedures.
- Profitability indicators did not match — everyone calculated them in their own way.
After implementing Power BI:
- a unified data model covering all branches was created;
- management saw which areas were stable and where margins were declining;
- it became possible to compare the effectiveness of points in real time—using the same metrics, without manual work.
This not only saved analysts time, but also allowed them to see for the first time how the business was performing in the regions — based on facts, not assumptions.

Checklist Before Hiring Power Bi Developers
Before looking for a Power BI developer, it is important to understand what you want to get from analytics and how to prepare your data. This will help make the implementation effective and avoid chaos in your reports.
- Define your business goals. Formulate what decisions analytics should support: sales, marketing, logistics, finance, operational efficiency.
- Gather all data sources. List where the information comes from: Excel, CRM, ERP, databases, external systems, API.
- Define key performance indicators (KPIs). Indicate what the focus will be: margin, conversion, average check, turnover, ROI, delays, returns.
- Assess the current state of reporting. Identify which processes take the most time, where conflicts arise, which reports are duplicated or not updated.
- Consider access levels. Fix who will view dashboards, who will edit them, and who will approve key performance indicators.
- Create examples of the dashboards you need. Show what visualizations, filters, comparisons, and interactivity are expected so that the developer understands the format and logic.
- Plan a pilot project. Test Power BI on real data before scaling it up to the entire company.
- Determine the need for support. Find out if technical support is needed after launch: source updates, report adaptation, team training.
- Create a data update schedule. Determine how often metrics should be updated: daily, weekly, monthly — and who is responsible for this.
- Assign people responsible for analytics. Decide who will coordinate the process: collect data, verify, update, and communicate with developers.
Conclusion
The decision to hire Power BI developers should be based on real business needs. What do you require, first and foremost: quick answers to questions, agreed metrics, real-time process control? If you don't have enough answers, reports take hours to generate, or each department sees its own “truth,” it's time to take action.
Start small: review sources, identify key metrics, and commission a pilot dashboard. This will allow you to assess the effectiveness of your analytics overall and see how data can help you make more accurate and timely decisions.