3 Practical Tips For Using Infographics On Your Website
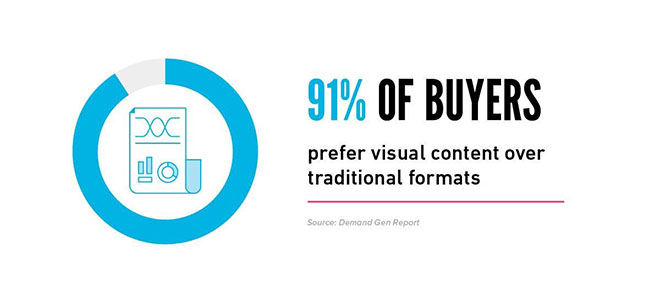
Did you know visuals can be understood by the human brains up to 60 thousand times faster than printed words?
Images, colors, and graphics play a significant role in both our personal and professional lives.
If you’re running a business, visuals and infographics can help you to increase traffic and boost conversions for your website. In fact studies claim that infographics have the ability to enhance web traffic by more than 12 percent.
The web has the potential to be a very visual media. As a result, we have the opportunity to express ideas in a way that goes beyond language while working in tandem with it.
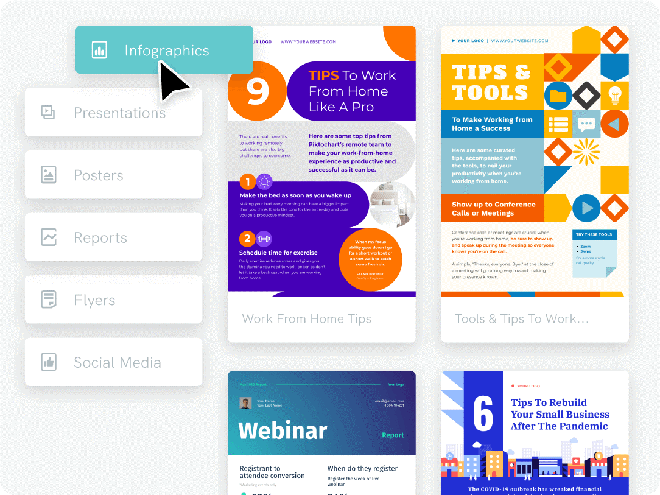
Infographics are visual data presentations that employ design features to express content.
If you look back in history, infographics have always been used to communicate complex information to audiences in a way that promotes attention and understanding.
Top 3 Tips for Using Infographics on Your Website

Infographics are three times more loved and shared on social media than other types of content. They are both shareable and educational. As a result, they are a valuable conversion method that may assist you in generating more leads.
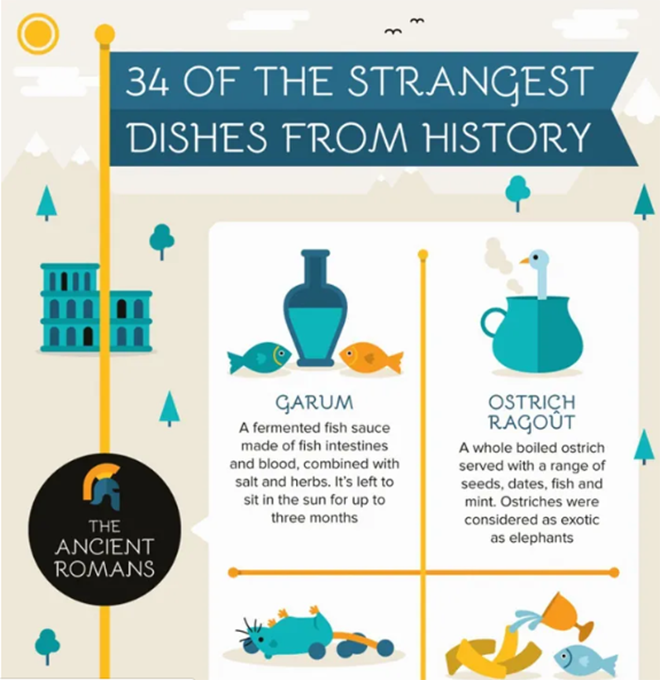
When infographics are well-designed and exhibited, they may transform difficult ideas or dull facts into engaging visual materials. They may also be utilized to attract visitors to your website.
It is a fact that the bulk of your website's users, around 60%, learn visually. This is most likely due to the fact that visual material is often easier to consume than plain and boring text.
But the question is how do you effectively use them on your website.
We have made it easier with our three tried-and-tested tips to use infographics on your website to boost your traffic and market presence.
Create a Visual Content Plan
Infographics are more than just a component of a great visual marketing strategy. There are several other forms of visuals that may be used in addition to the infographics.
When it comes to website design for coaches, having a cohesive visual strategy helps create a professional and engaging experience for visitors. While infographics are powerful tools for explaining your services, they should complement your overall visual branding to effectively showcase your expertise.
An infographic represents more than the data collection visualizations arranged in a coherent pattern to convey a narrative.
Perhaps no other style of visual excels at this more than infographics. Its primary goal is to take an idea and convey it in a simple and visual manner.
Nowadays, everyone creates infographics. As a result, some of the infographics look repetitive in their look and feel as well as their message. An engaging infographic will immediately capture your viewers’ attention and they will be able to absorb complex ideas easily if you create infographics and post them on your website.
According to a brand awareness survey, infographics may remarkably improve your market visibility, as well as your popularity among target buyers. Make certain that your visual content or infographics contains all of the key components for success, that might include:
Screenshots
We all understand the value of a screenshot taken on perfectly. Any digital service or product, whether it is a video game or a budgeting application, is best explained using relevant and supporting graphics.
Presentations
Whether you've been publishing to PowerPoint or providing live demos, a well-designed presentation is a great tool for conveying your message and connecting with your listeners.
Videos
Videos may bring your demos to life, provide a hilarious method to promote to your consumers, or express a sense and impact to your future marketing efforts.
Rich and entertaining, well-produced clips are one of the most expensive kinds of advertising, but they are worth the expense.
Images
Images are crucial for everything, from product catalogue to the infographic design. Consider the sort of picture you want to utilize so that your style remains consistent.
A great way to do so on a low budget is to use an AI image generator and create them from scratch.
Memes
Eloquent and widely shareable, memes are a great way to engage with the audience, especially if you're promoting to a younger demographic.
Write a Blog Post to Showcase Your Infographics

Once you've generated the infographics that you're pleased to show off, you'll need to establish a page to showcase it on.
One possibility is to create a blog post in which you can present your infographics. If you don't already have a blog, now is a great time to start one.
Firms with blogs generate 67% higher leads each month than companies without them.
The post should go into the topic of your infographics in further detail. You don't have to compose a lot of content, but it may be useful to compose a long-form piece. Long-form blog posts generate up to 9 times extra leads as compared to that of short-form one.
Further, around 85 percent of the marketers claimed in a recent survey that more than 75% of their blogs included some form of image.
According to the same survey, around 9% claimed that just 50% to 80% of their posts had at least one type of image, while 8% stated that roughly half of the postings included visuals. After you've finished writing a blog post, you can publish it on your website.
Before you begin, ensure that the infographic is in the proper size and that it is of the highest quality available. Nothing is more frustrating than opening on a picture only to be met with a hazy, unclear image.
The majority of infographics are about 800 to 1,000 pixels in size. Before posting your infographics image to your website, ensure it is properly sized and clear to read.
You can use an infographic maker to generate high quality infographics. The tool will create infographics which you can add on your website. However, to function successfully, an infographic must be well-executed, and you must know how to exhibit and share it in order to get the greatest exposure.
Having said that, the headline of the blog should be fascinating and optimized for two purposes:
- Want the readers to discover your material naturally by using the proper search terms.
- Keep in mind that one of the finest aspects of an infographic is how widely they are being shared over social media. A compelling headline to accompany the shared social posts might entice users to read it.
Infographics are a blend of design, texts, and analysis of the research that is appropriate for the global era of networking.
Share the Infographics on Social Media Platforms

When it comes to digital marketing, 80 percent believe they employ graphic assets, and there’s a rationale behind it.
Tweets with photos receive 150 percent greater retweets, 89 percent higher likes, and 18 percent more clicks.
Post your infographic on the social media platforms, along with a reference to the actual website page where you discovered it.
Sharing increases the opportunity of your images of reaching the proper audience, gaining views, and being shared.
Take into account that owing to image size limits on each site, you may need to publish a resized edition of your infographics on social media.
Here are some picture size guidelines for a few of the prominent social sites.
- The standard size to look enlarged on Twitter is 440 x 220 pixels, and the maximum size is 1,024 x 512 pixels.
- The suggested upload size for Facebook is 1,200 x 630 pixels.
- Image sizes on Instagram have been raised to 1080 x 1080 pixels, although photographs are still scaled down to roughly 612 x 612 pixels.
- On Pinterest, enlarged pins should have at least a width of 600 pixels.
In comparison to other types of content, such as texts, infographics may explain difficult or uninteresting facts in a visual style that captures the viewers’ attention.
The advantages do not end here. Infographics are loved and shared more than other types of content on social media, and they might even increase online traffic.
Few Tips to Consider While Adding Infographics
Infographics are a strong tool for allowing people to readily absorb information by utilizing visual data, graphs, and figures. Information may be converted into attention-grabbing, unique, and even compelling images with the appropriate use of color, ratio, and white space.
- When developing an infographic, the graphics should always be designed and organized around the facts.
- Make a headline for the infographic at the top. If you want, write a quick introduction that describes your infographic.
- Finally, include all your visuals' essential material. Separate the text and symbols into categories.
- At the lower edge of the infographic, provide a call-to-action that prompts users to take actions. This request may include signing up for your newsletters, download case studies or visiting another page on your web site.
- Compose a blog post where you can present your infographic. Insert an embed code to the website where your infographics are hosted so that people may simply share your picture.
- For optimum visibility, share your infographics with your social media followers.
Conclusion
Visuals can help us communicate our message more effectively.
Infographics aren't just a terrific way to present information, but their simplicity and compactness make them excellent for sharing it with others.
But again like any other marketing strategy, there is no clear blueprint for success. The tips shared above are just guidelines for you to effectively use infographics on your website.
Remember to utilize infographics as instruments to spread your message. They may be the most adaptable instruments we have for promoting both concepts and services.
Recommended Posts

The Power of UGC (User-Generated Content) in Event Marketing
February 9, 2025


This blog highlights the importance of responsive web design. For businesses that need a site to look great across devices, can help make that a reality.