
MEC Advanced Reports Addon
The Advanced Reports Addon is a professional reporting and analytics tool for Modern Events Calendar (MEC). It transforms booking and event data into clear, actionable reports, helping event organizers and administrators understand sales performance, attendee activity, revenue, payment methods, and event trends.
The new version introduces an improved analytics dashboard, event-first reporting, financial details, customizable reports, occurrence and payment gateway filtering, professional PDF reports, and automatic report delivery to event organizers.
With these features, Advanced Reports goes beyond displaying raw booking data and provides a complete solution for analyzing event performance and preparing reports for internal teams, clients, and organizers.
Requirements
- MEC Pro: The Advanced Reports Addon requires Modern Events Calendar Pro.
- Installation: Modern Events Calendar and the Advanced Reports Addon must both be installed and activated on your WordPress website.
Read Also:
How to install MEC and Addons?Initial Setup
After installing and activating the addon, a new Advanced Reports menu will be available in the MEC settings.
Open MEC → Advanced Reports to access the reporting dashboard and its configuration options.
The Advanced Reports dashboard is divided into several sections, including:
- Global report filters
- KPI cards
- Sales / Attendees analytics
- Payment Gateway analytics
- Top Events
- All Attendees
- Report customization and presets
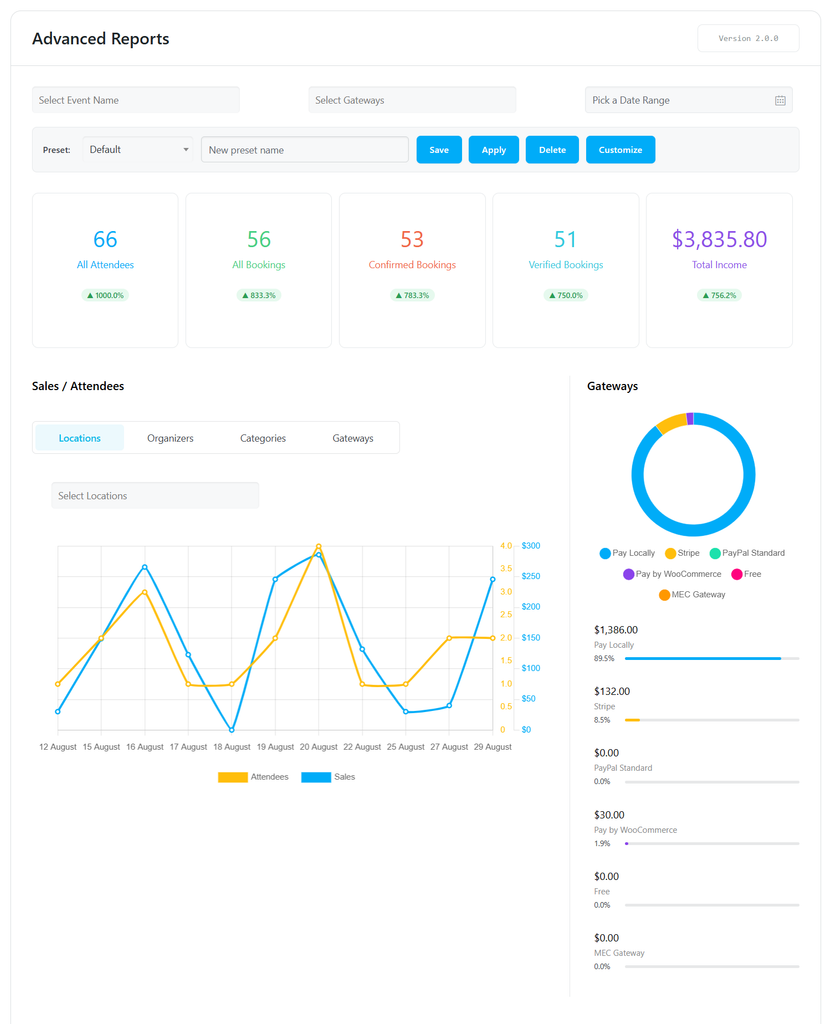
Advanced Reports Dashboard
The Advanced Reports dashboard provides a centralized view of your event performance. All major statistics and charts respond to the filters selected at the top of the page.
Global Filters

At the top of the dashboard, you can filter the report using options such as:
- Event Name
- Payment Gateway
- Date Range
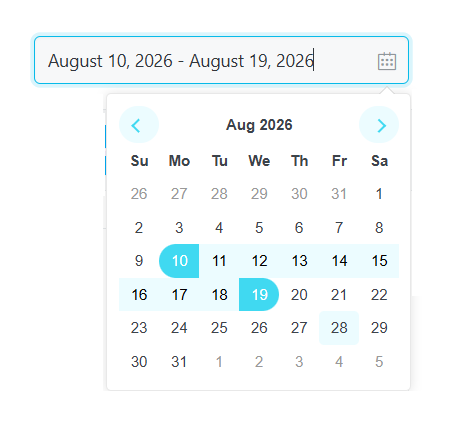
These filters allow you to narrow the report to the exact data you want to analyze.
All relevant statistics, charts, event summaries, and attendee data are updated according to the selected filters.
Presets
Advanced Reports allows you to save frequently used report configurations as presets.

The preset controls include:
- Preset: Select an existing saved configuration.
- New Preset Name: Enter a name for a new preset.
- Save: Save the current report configuration.
- Apply: Apply a saved preset.
- Delete: Remove an existing preset.
- Customize: Configure the columns and charts displayed in the report.
Presets are useful when different users or teams regularly need different report formats.
KPI Dashboard
The KPI section provides a quick overview of the most important event metrics.
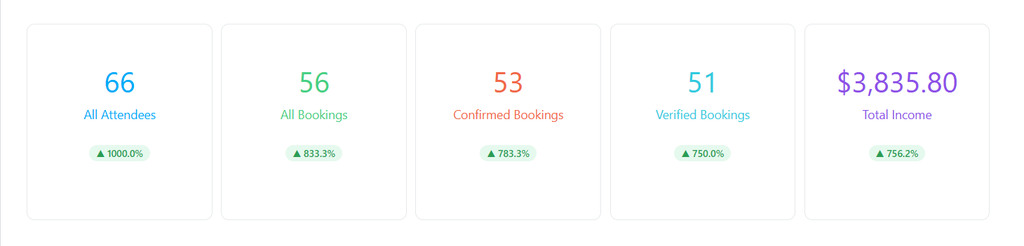
The dashboard includes the following KPI cards:
All Attendees
Displays the total number of attendees included in the current report.
All Bookings
Displays the total number of bookings matching the selected filters.
Confirmed Bookings
Shows the number of confirmed bookings.
Verified Bookings
Shows the number of verified bookings.
Total Income
Displays the total revenue generated by the bookings included in the report.
Performance Trends
KPI cards can also provide a comparison with the previous reporting period, allowing you to quickly identify whether performance is increasing or decreasing.
Trend information helps administrators understand the direction of their event performance without manually comparing separate reports.
Sales and Attendees Analytics
The Sales / Attendees section provides visual analysis of booking activity and revenue over time.
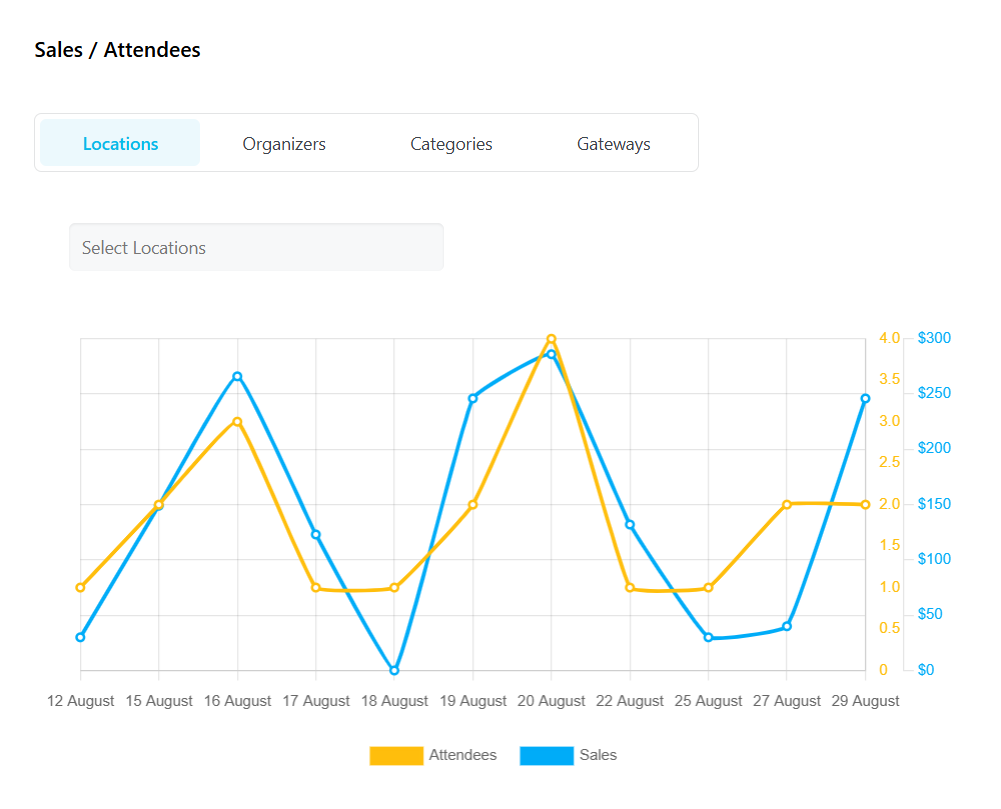
The chart can be analyzed according to different dimensions, including:
- Locations
- Organizers
- Categories
- Payment Gateways
This makes it possible to compare attendee activity and sales performance across different parts of your event data.
Sales and Attendees Chart
The chart provides a visual representation of sales and attendee activity within the selected date range.
The data is automatically affected by the global filters selected at the top of the dashboard.
For example, selecting a specific organizer or category limits the chart to the relevant events.
Gateway Analysis
When Gateways is selected, the report can be used to compare revenue generated through different payment methods.
Pie Chart: Illustrates the overall percentage distribution of all payments.
Horizontal Bar Charts: Displays the exact monetary amount and percentage for each individual payment gateway (e.g., PayPal, Stripe, Local).
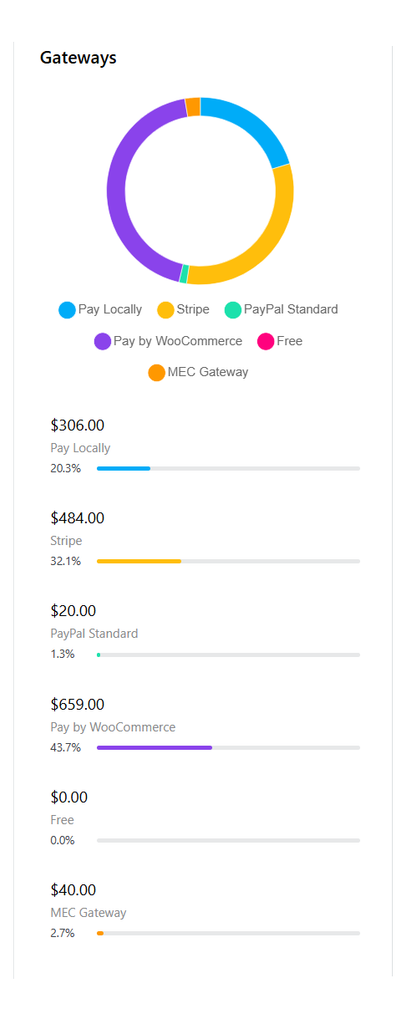
This can help administrators understand:
- Which payment gateway generates the most revenue
- How revenue is distributed between gateways
- Payment behavior across different events
Top Events
The Top Events section provides an event-first summary of the report.
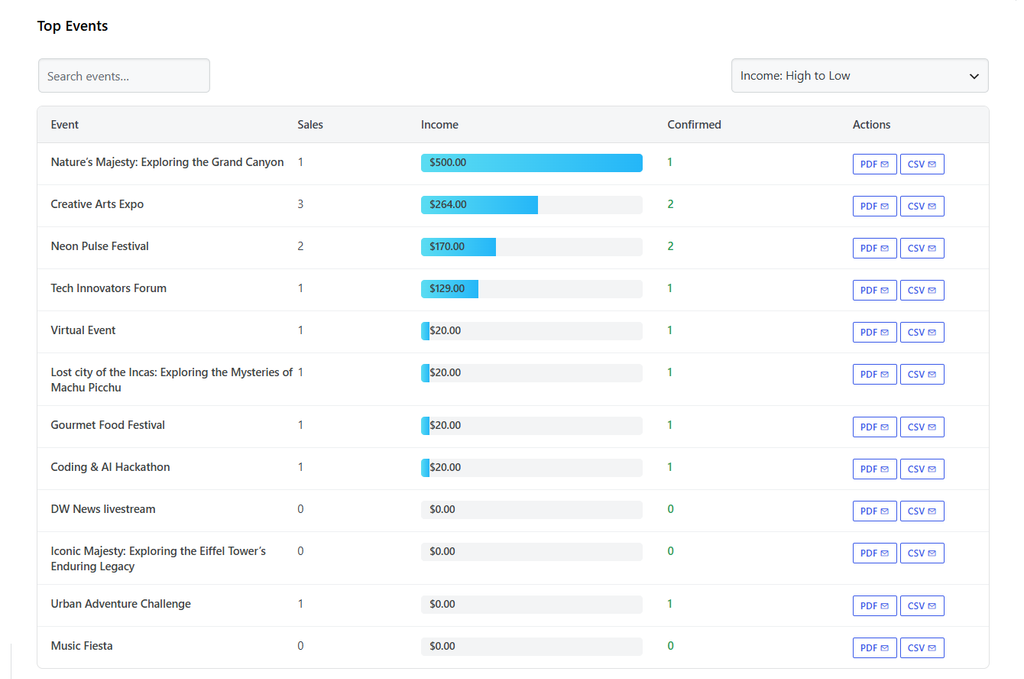
Instead of starting with individual bookings, this section allows you to analyze the overall performance of your events.
The table includes information such as:
- Event name
- Number of sales
- Income
- Confirmed bookings
Searching Events
Use the search field to quickly find a specific event.
Sorting Events
Events can be sorted according to their performance, including:
- Income: High to Low
- Income: Low to High
- Sales: High to Low
- Sales: Low to High
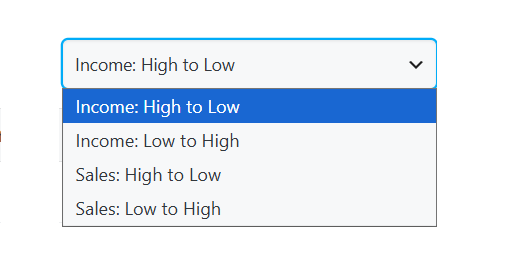
This makes it easier to identify the best-performing events or events that may require further attention.
Event Filtering
Clicking an event in the Top Events table applies it as a filter to the report, allowing you to analyze the selected event using the dashboard and charts.
Occurrence Filtering
When you select an event from the Top Events table, the selected event is applied as a filter to the report. The KPI Dashboard and charts are then updated to display data related to that event.
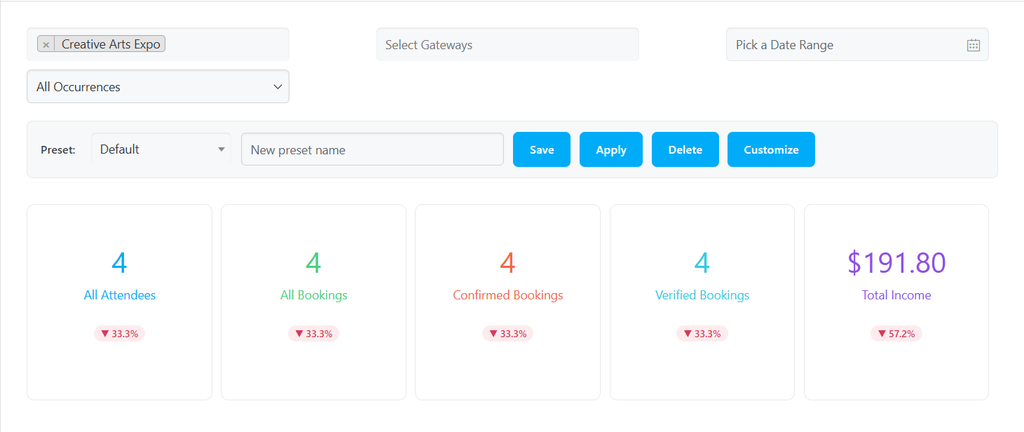
If the selected event contains multiple occurrences, an Occurrence filter is displayed below the Event filter. You can use this filter to select a specific occurrence and further narrow down the report.
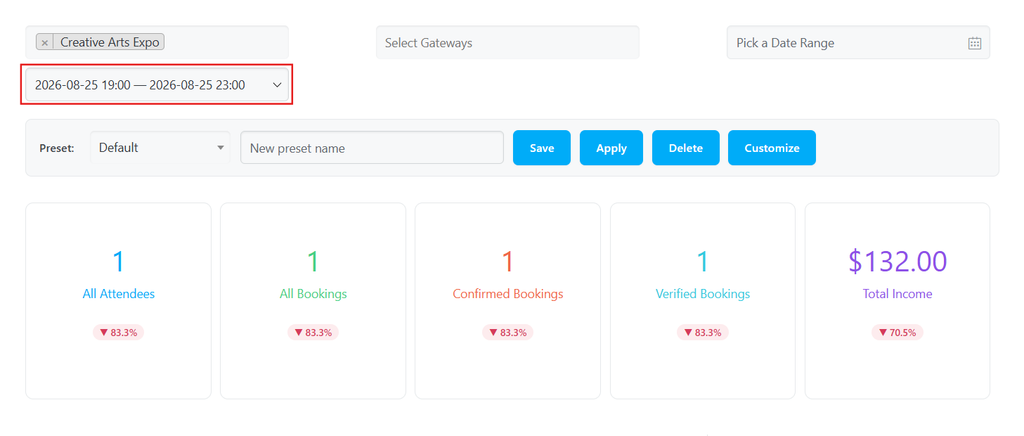
This allows you to analyze:
- All events included in the current report
- A specific event
- A specific occurrence of an event with multiple occurrences
The selected filters are applied across the relevant report sections, including the KPI Dashboard and charts.
Example
For example, clicking an event in the Top Events table applies the selected event as the active Event filter.
If the selected event has multiple occurrences, an Occurrence field becomes available below the Event field. You can then select a specific occurrence to further filter the report.
This provides an event-first workflow where you can start with an event in the Top Events list and then narrow the analysis down to a specific occurrence when applicable.
Actions
The Actions column provides quick options for sending a complete report for each event directly to its organizer.
Two actions are available:
- PDF: Generates and sends a complete PDF report for the selected event to its organizer.
- CSV: Generates and sends a complete CSV report for the selected event to its organizer.
Clicking either button generates the report using the data associated with that event and sends it directly to the organizer assigned to the event.
This allows administrators to send an event-specific report to the organizer without having to generate or send the report manually.
All Attendees
The All Attendees section provides detailed information about the individual bookings included in the report.
The attendee list can be accessed directly by clicking on a KPI card. Each KPI opens the corresponding attendee data, allowing you to view the bookings related to that metric.
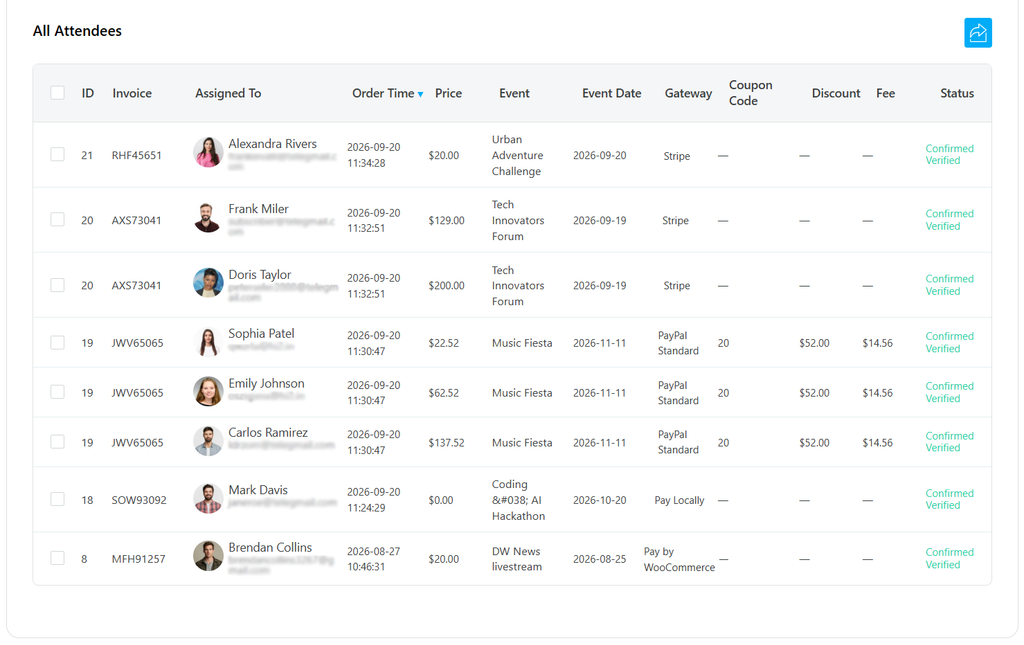
The available data can include:
- Booking ID
- Invoice
- Assigned User
- Order Time
- Price
- Event
- Event Date
- Payment Gateway
- Coupon Code
- Discount
- Fee
- Booking Status
Navigation and Filtering
The Attendees List provides several filtering options to help you narrow down the displayed bookings.
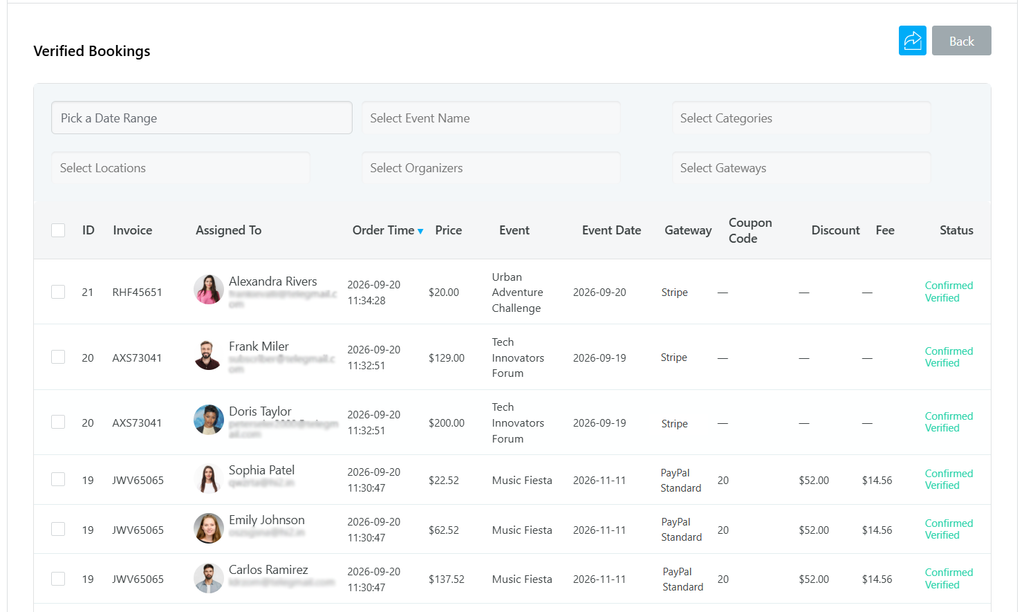
Available filters include:
- Date
- Event Name
- Category
- Location
- Organizer
These filters can be used together to further refine the attendee list.
The attendee list is also affected by the filters selected in the report dashboard, allowing you to view the bookings relevant to the selected report criteria.
KPI-Based Attendee List
Clicking on a KPI card opens the attendee list related to that KPI.
This provides a direct way to move from the dashboard statistics to the corresponding attendee records. After opening the list, you can further filter the results using Date, Event Name, Category, Location, and Organizer.
Customizing Reports
Advanced Reports allows you to control which information is displayed in the report.
Click Customize to configure the report layout.
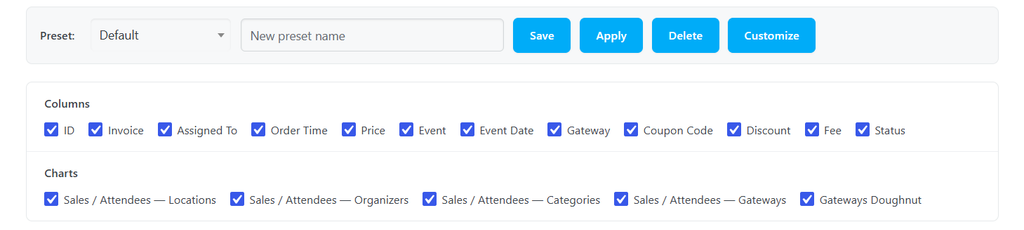
Customizable Columns
You can enable or disable individual columns according to your reporting requirements.
Available columns can include:
- ID
- Invoice
- Assigned To
- Order Time
- Price
- Event
- Event Date
- Gateway
- Coupon Code
- Discount
- Fee
- Status
This allows administrators to create a simpler report for everyday use or a more detailed report for financial analysis.
Customizable Charts
You can also control which analytical charts are displayed.
Available chart options can include:
- Sales / Attendees by Locations
- Sales / Attendees by Organizers
- Sales / Attendees by Categories
- Sales / Attendees by Gateways
- Gateway Doughnut Chart
Only the selected charts are displayed in the customized report.
Saving Customizations as Presets
After configuring the columns and charts, the configuration can be saved as a preset.
This allows the same report structure to be reused without configuring the dashboard every time.
For example, an administrator can create separate presets for:
- Financial Reports
- Event Performance
- Organizer Reports
- Attendance Reports
Exporting Reports
Advanced Reports provides export options for taking report data outside the WordPress dashboard.
Export Formats
The Advanced Reports Addon allows you to export attendee data in the following formats:
- CSV (Excel-compatible)
- XML
- JSON
Click the Export icon  to download your data.
The exported report provides a list of attendees based on the selected report data and filters.

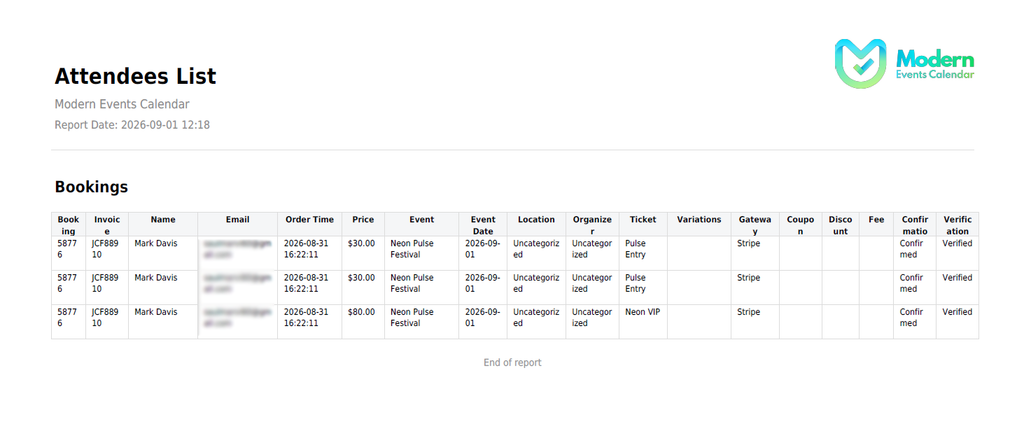
PDF Export
PDF is a new export format in the updated version of Advanced Reports.
Unlike the CSV, XML, and JSON formats, PDF provides a formatted version of the attendee report that is suitable for viewing and sharing.
The PDF report displays the MEC logo in the header.
Sending Reports to Organizers
Advanced Reports can automatically generate and send reports to the organizer of an event.
Open:
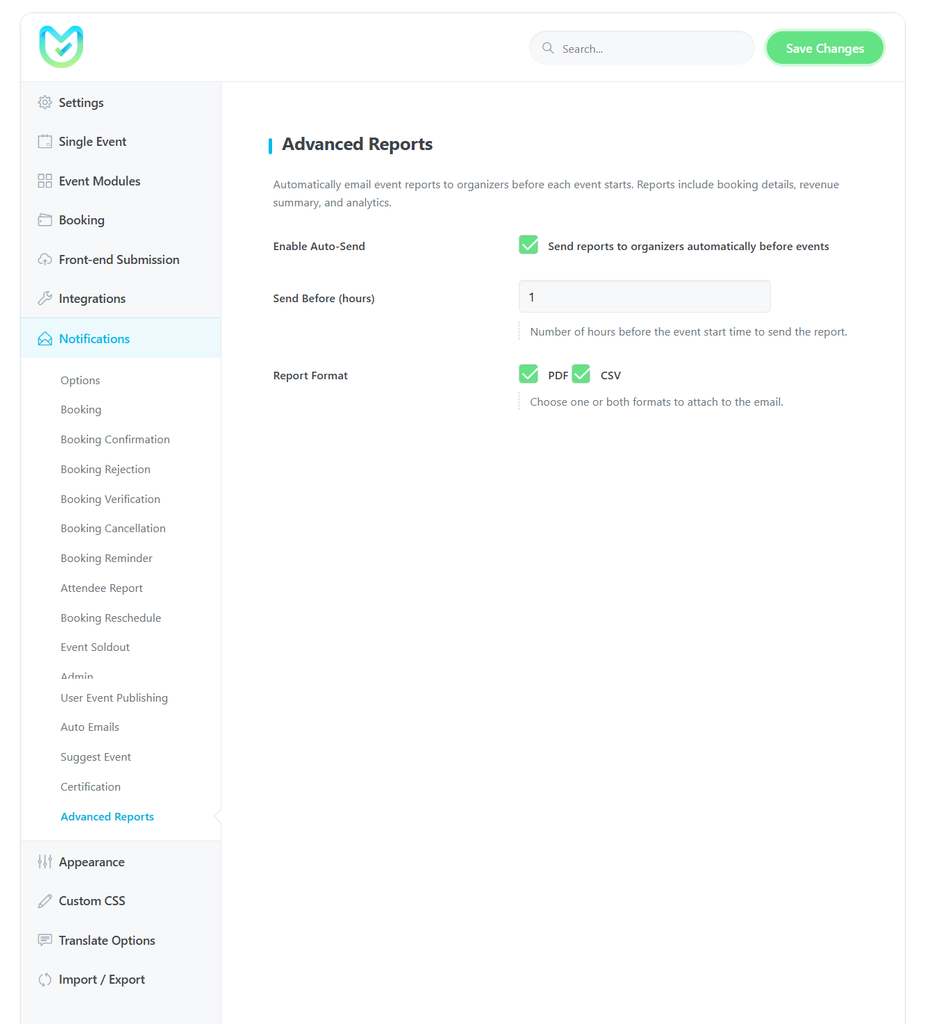
MEC → Settings → Notifications → Advanced Reports
to configure automatic organizer reports.
Auto-Send Reports
Enable Auto-Send Reports to allow MEC to send reports automatically to organizers.
Send Before Event
The Send Before (hour) option determines how many hours before the event starts the report should be sent.
For example, if the value is set to 24, the report can be generated and sent approximately 24 hours before the event.
This removes the need for an administrator to manually prepare a report before every event.
Report Format
You can select the format of the automatically generated report:
- CSV
The report is generated according to the configured report settings and sent to the relevant organizer.
Troubleshooting for Beginners
Advanced Reports Menu Is Missing
Make sure:
- Modern Events Calendar Pro is installed and activated.
- Advanced Reports Addon is installed and activated.
- The addon is compatible with the installed MEC version.
No Data Appears in the Report
Check the active filters.
A selected event, gateway, occurrence, category, organizer, location, or date range may exclude the bookings you expect to see.
Try clearing the filters and generating the report again.
An Event Does Not Appear in Top Events
Check the selected date range and other global filters.
If the event does not match the active filters, it will not be included in the results.
Coupon or Fee Information Is Missing
Make sure the relevant columns are enabled under Customize.
Disabled columns are not displayed in the report table.
A Payment Gateway Is Not Shown
Check whether the booking contains payment gateway information and whether the Gateway column or gateway chart has been enabled in the report configuration.
An Occurrence Is Not Available
The occurrence filter is intended for events with multiple occurrences.
For single-occurrence events, there is no separate occurrence to select.
Automatic Organizer Reports Are Not Sent
Check:
- Auto-Send Reports is enabled.
- A valid value has been entered in Send Before (hour).
- The event has an organizer assigned.
- A supported report format such as PDF or CSV has been selected.
- WordPress scheduled tasks are functioning correctly.
FAQ
What is the Advanced Reports Addon for MEC?
The Advanced Reports Addon provides advanced analytics and reporting for MEC bookings and events. It includes KPI statistics, event performance analysis, attendee reports, financial information, payment gateway analysis, customizable reports, and PDF/CSV exports.
Is Advanced Reports available for MEC Lite?
No. Advanced Reports requires MEC Pro because it relies on MEC’s booking functionality.
Can I generate a report for a specific event?
Yes. You can filter the dashboard by event and generate a detailed report for the selected event.
Can I generate a PDF report?
Yes. The new version supports PDF export for the attendee report. The PDF includes the attendee data available in the report and displays the MEC logo in the header.
Can I export my reports as CSV?
Yes. Report data can be exported in CSV format for spreadsheet analysis, accounting, and other external workflows.
Can I filter a report by payment gateway?
Yes. Payment Gateway can be used as a report filter and as an analytical dimension in the dashboard.
Can I filter the report by occurrence?
Yes. If the selected event has multiple occurrences, an Occurrence filter is displayed below the Event filter. You can select a specific occurrence to further filter the report.
Can I include coupon and fee information in my reports?
Yes. Coupon Code, Discount, Fee, and related financial information can be included in the report when the corresponding columns are enabled.
Can I customize the report columns?
Yes. You can enable or disable available columns from the Customize option
Can I customize the charts?
Yes. Advanced Reports allows you to select which charts are displayed, including analysis by location, organizer, category, and payment gateway.
Can I save my report configuration?
Yes. You can save customized columns and charts as presets and reuse them later.
Can reports be sent automatically to organizers?
Yes. The Auto-Send Reports feature can generate a report and send it to the event organizer before the event.
How far before an event can the report be sent?
You can define the number of hours before the event using the Send Before (hour) setting.
Which formats are available for automatic organizer reports?
Automatic organizer reports can be sent as PDF or CSV.
Can I analyze my best-performing events?
Yes. The Top Events section provides a summary of event sales and income and allows you to sort and search events based on their performance.
Do all dashboard charts follow the selected filters?
Yes. The dashboard analytics are designed to work with the global report filters, allowing you to analyze the same filtered dataset across different sections.